
1. What Are Supply and Demand Zones?2. Identify Swing Highs and Lows3. Draw Horizontal Lines4. Look for Significant Price Reversals5. Validate with Multiple Timeframes6. Avoid Overcomplicating7. Practice and Patience8. Use Additional Tools9. Test Your Zones10. Continuous LearningConclusionIf you are new to the world of forex trading, you might have heard about supply and demand zones. …

If you are new to the world of forex trading, you might have heard about supply and demand zones. These zones are key areas where the price can potentially reverse or accelerate its movement. Understanding how to identify them is crucial for your trading success.
In this article, I will guide you through the process of identifying supply and demand zones in a way that’s easy to grasp.
Contents [hide]
1. What Are Supply and Demand Zones?
Before diving into how to identify these zones, let’s clarify what they are. In simple terms, supply and demand zones are areas on a price chart where the balance between buyers and sellers shifts.
Supply Zone: This is an area where selling interest exceeds buying interest, causing the price to fall. Think of it as a “ceiling” where the price tends to reverse.
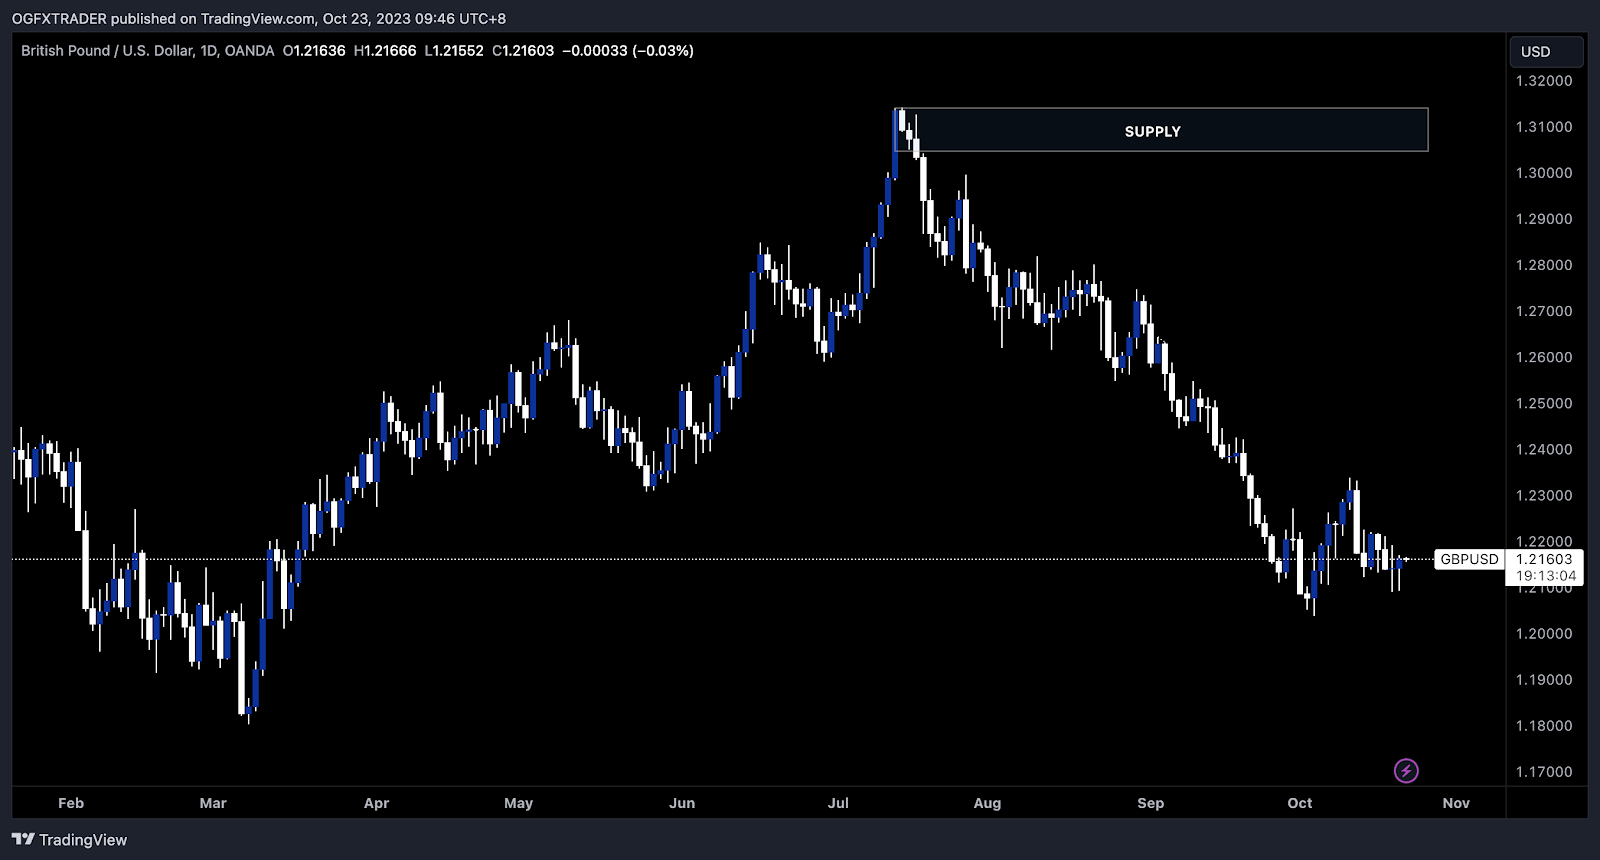
Chart link: https://www.tradingview.com/x/IvWv3A3Z/
Demand Zone: On the flip side, the demand zone shows where buying interest exceeds selling interest, leading to price increases. It’s like a “floor” where price reversals often occur.
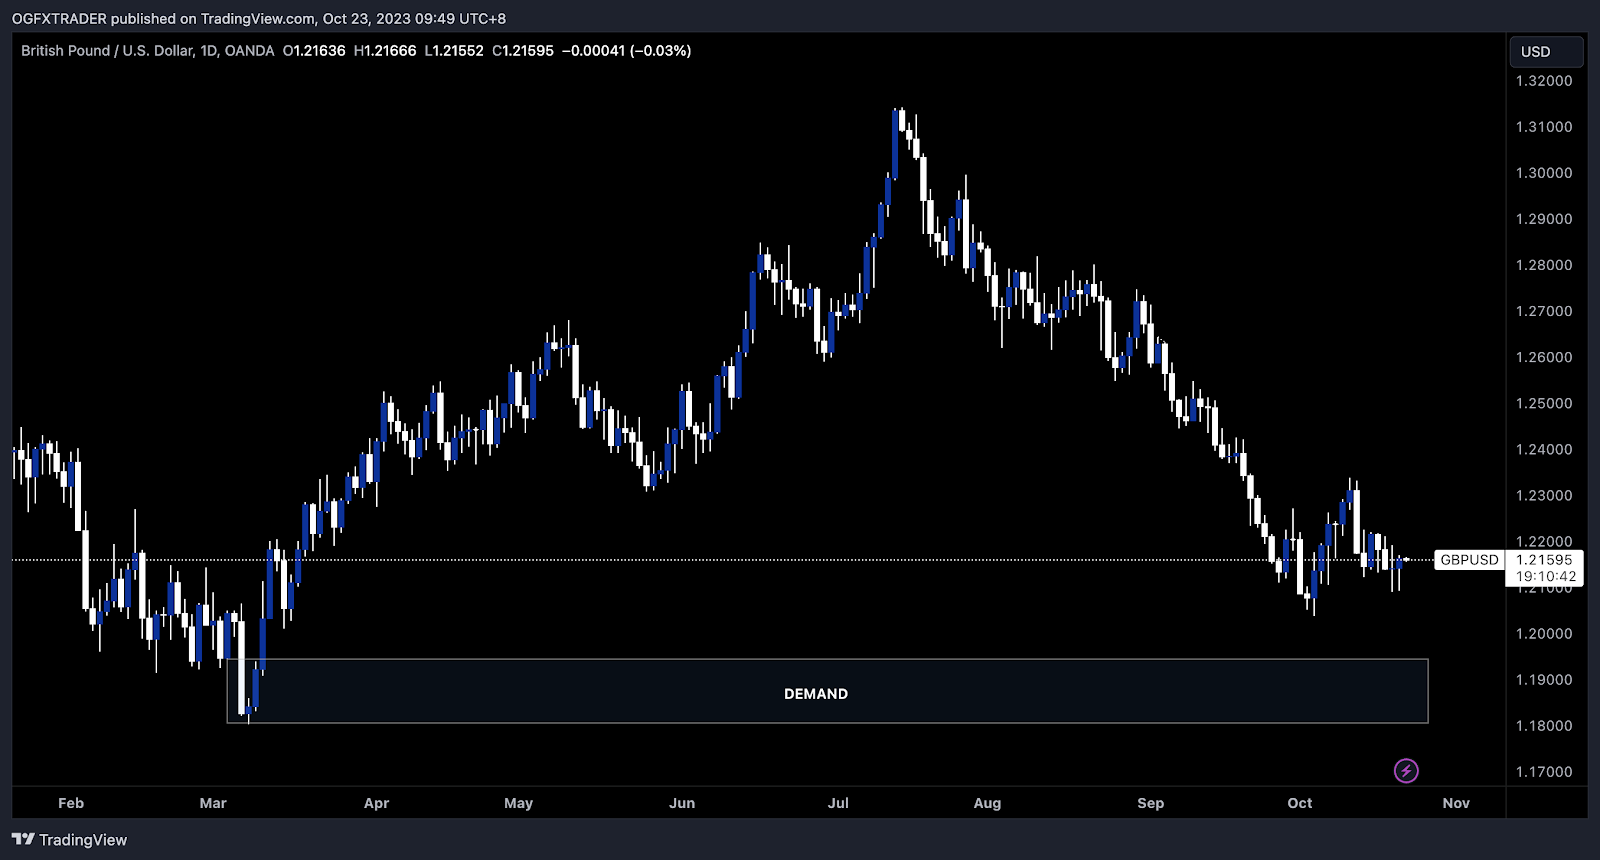
Chart link: https://www.tradingview.com/x/jbfcPDb3/
2. Identify Swing Highs and Lows
Identify swing highs and lows on your price chart to spot supply and demand zones. Swing highs are local price peaks, while swing lows are price valleys. These swings help you determine potential zones where the market might experience reversals, providing valuable insights for making informed trading decisions.
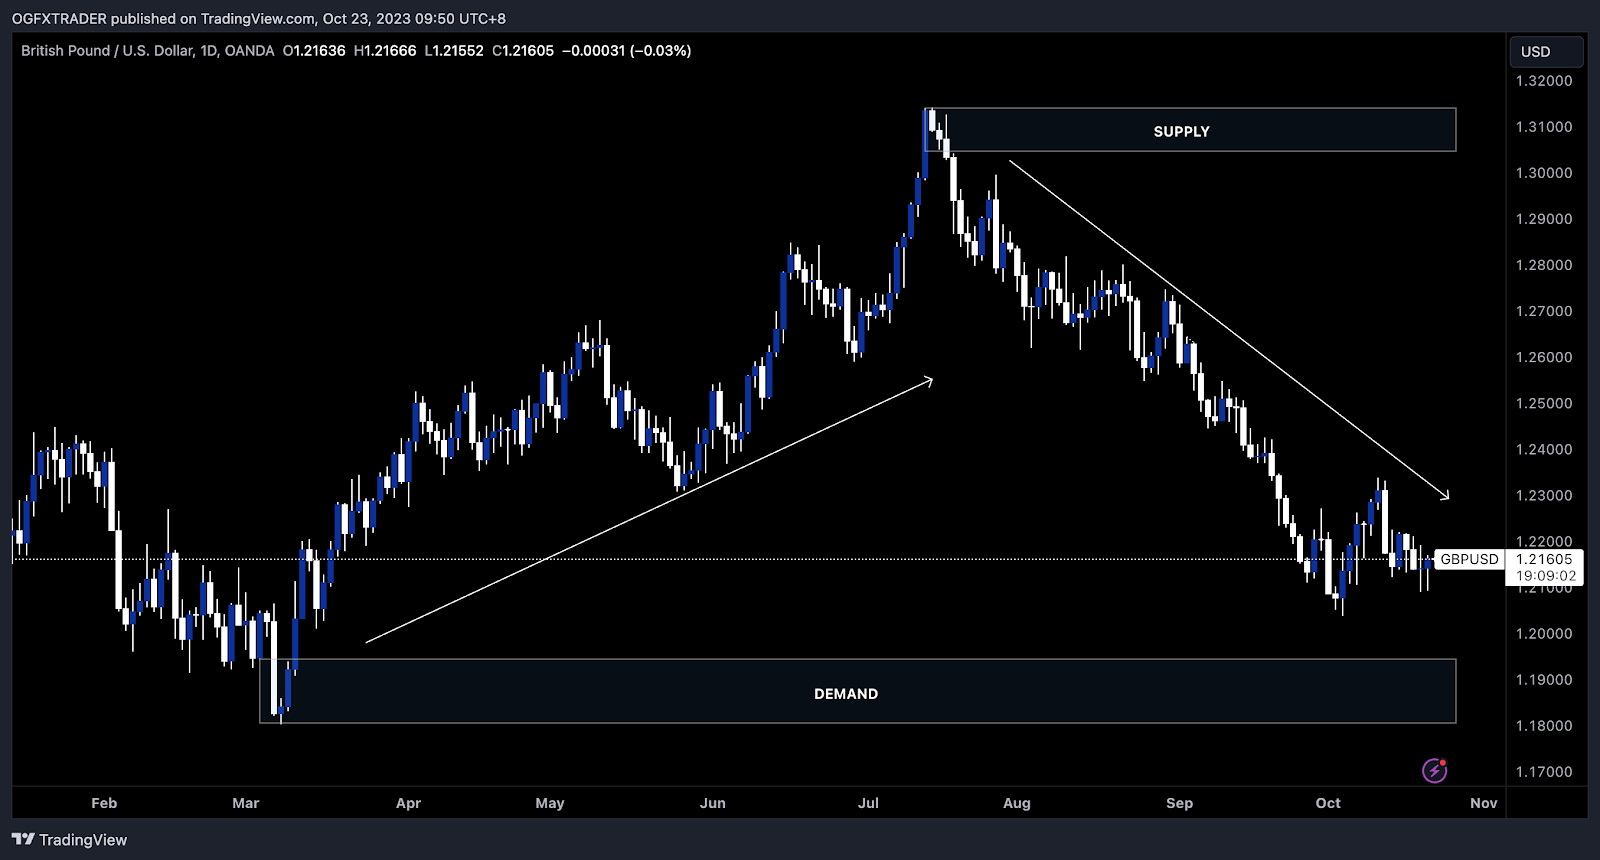
Chart link: https://www.tradingview.com/x/6QtBXp9N/
3. Draw Horizontal Lines
Draw horizontal lines across these levels once you’ve identified swing highs and lows. These lines represent the potential areas where supply and demand zones may develop.
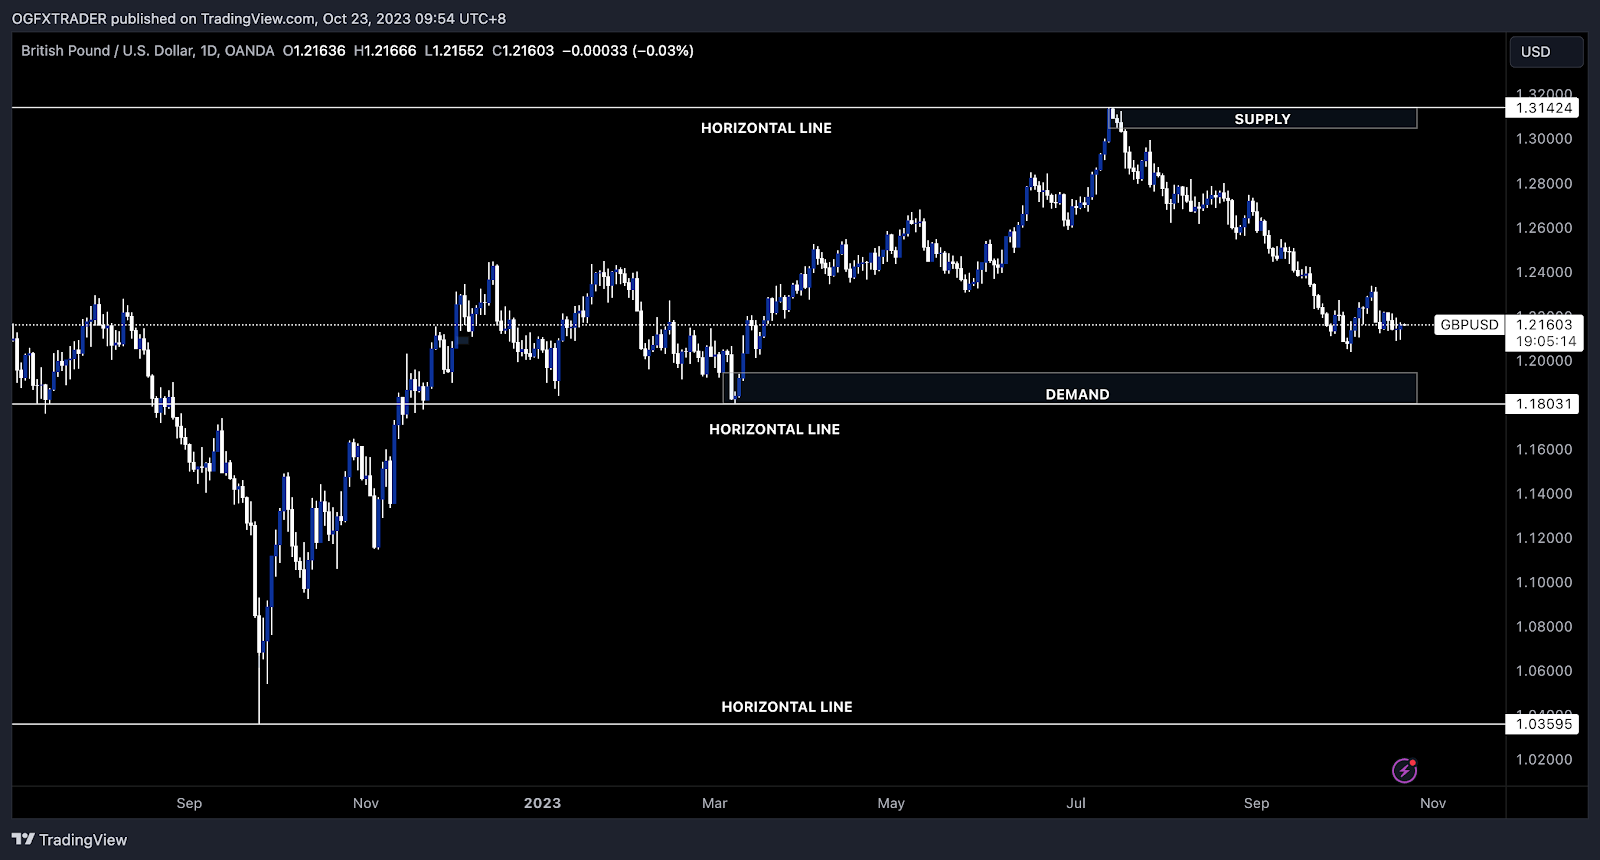
Chart link: https://www.tradingview.com/x/0BcHz3u0/
4. Look for Significant Price Reversals
Supply and demand zones often form around significant price reversals. These areas indicate a shift in market sentiment. Pay close attention to candlestick patterns and volume at these levels.
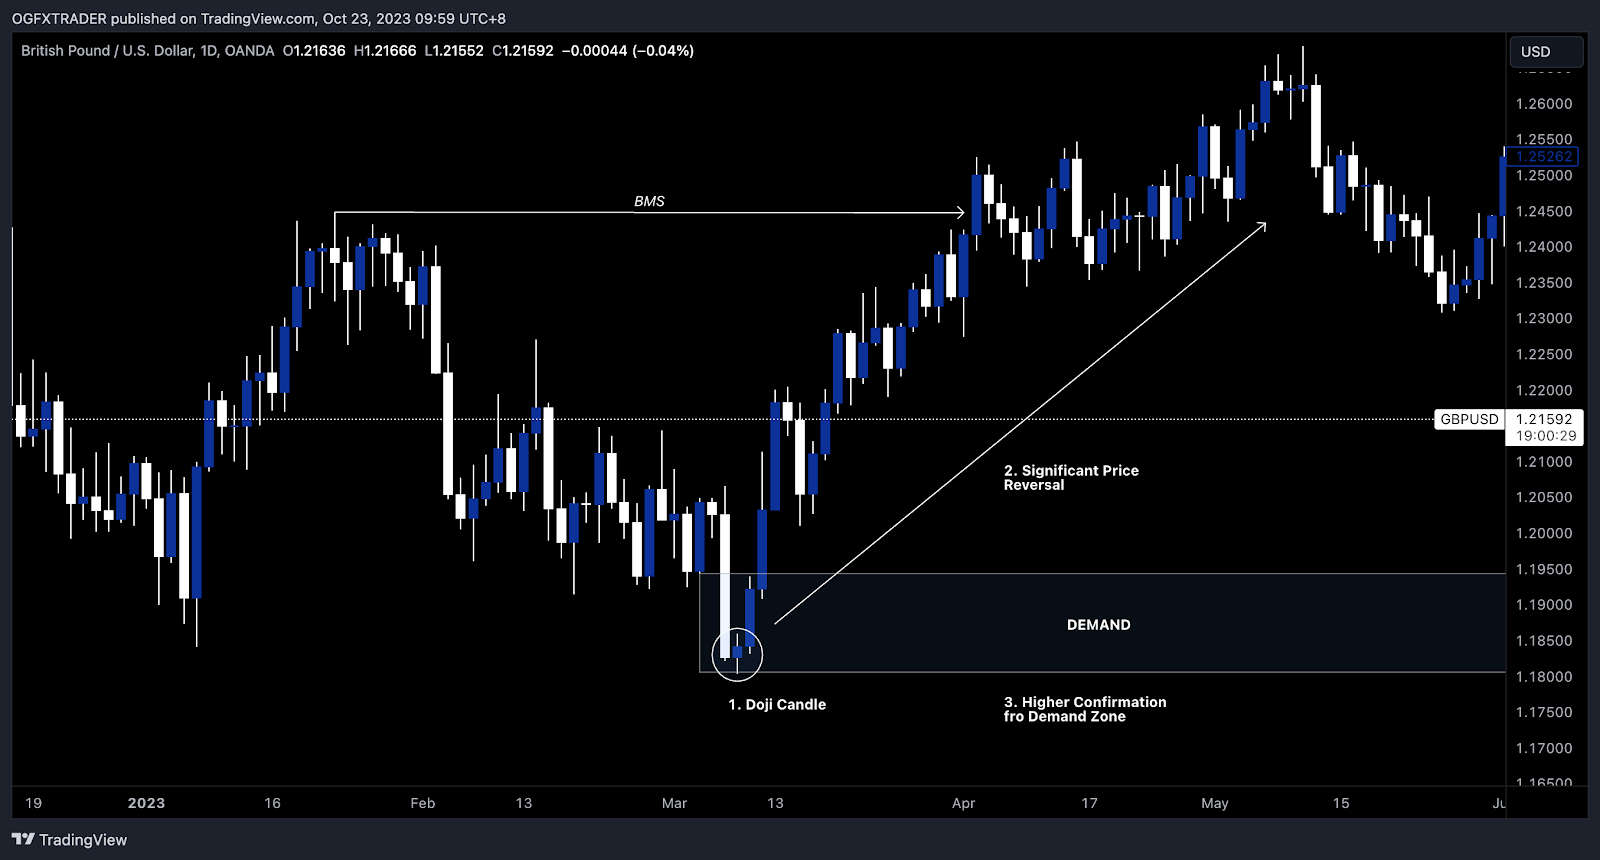
Chart link: https://www.tradingview.com/x/U4YCmG1P/
5. Validate with Multiple Timeframes
To increase the accuracy of your supply and demand zones, validate them by checking multiple timeframes. A zone that aligns on various timeframes is more likely to be significant.
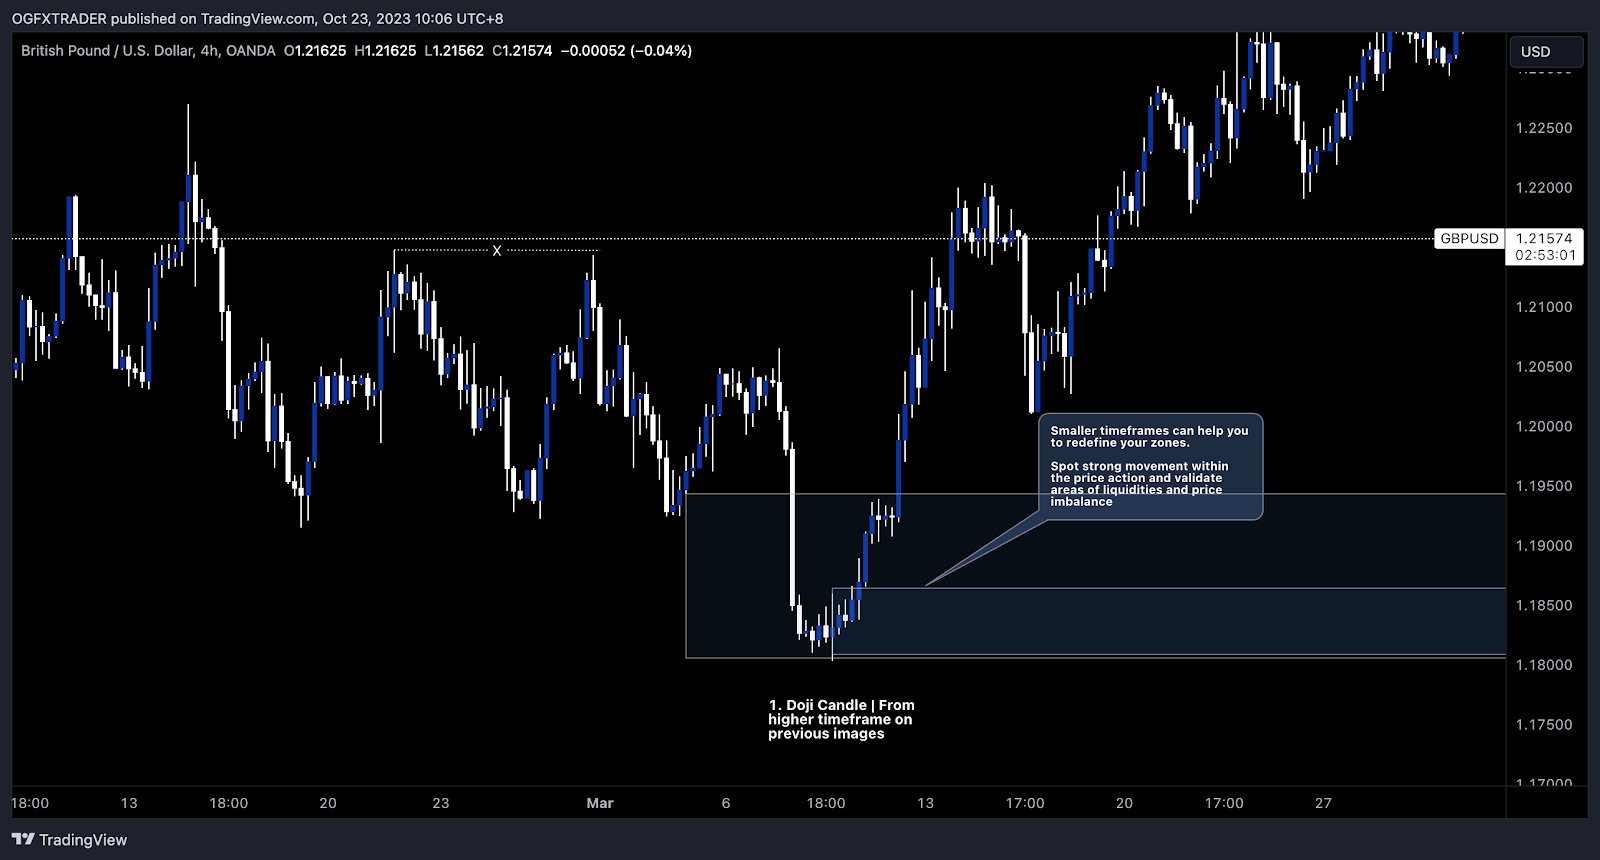
Timeframe H4
Chart link: https://www.tradingview.com/x/4Qd7PSr2/
6. Avoid Overcomplicating
New traders often overcomplicate things. Please keep it simple. Focus on the most recent and obvious swing highs and lows. Don’t clutter your chart with too many lines.
7. Practice and Patience
Identifying supply and demand zones takes practice. Be patient with yourself as you refine this skill. Do not rush into trades until you’re confident in your analysis. Confirm how prices will react once they reach those identified zones. You can also use back-testing tools in your charting software.
8. Use Additional Tools
Incorporate other technical analysis tools like trendlines, moving averages, and RSI to complement your supply and demand zone analysis.
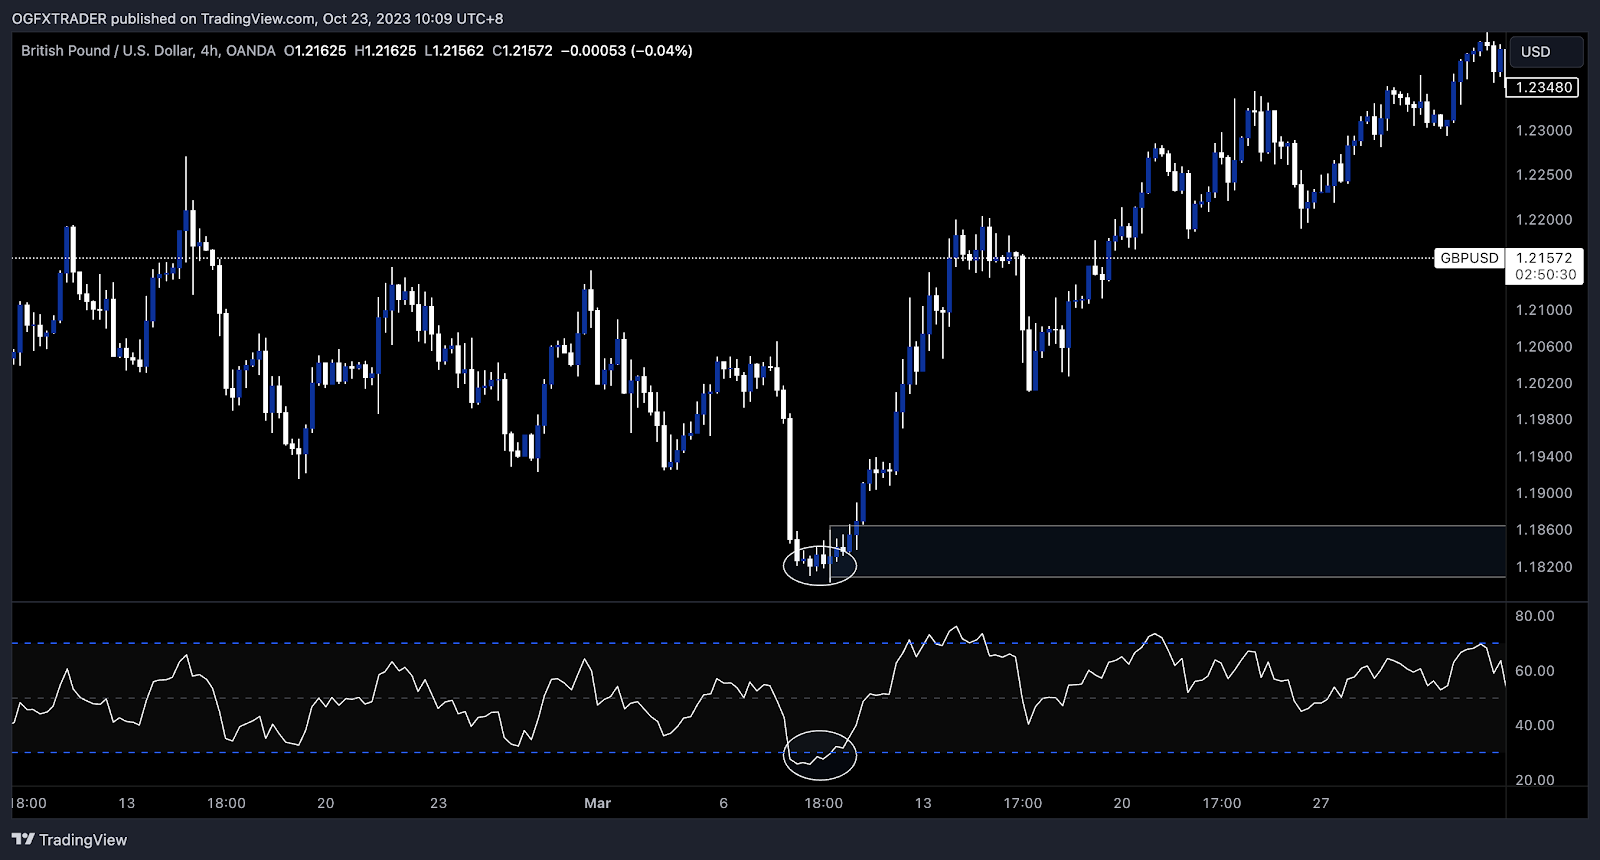
Using RSI to confirm an oversold zone helps to confirm a strong level for price reversal.
Chart link: https://www.tradingview.com/x/HjFNYelu/
9. Test Your Zones
Once you’ve identified a zone, test it with real trades, but start with small positions. This will help you build confidence and refine your approach. Test your strategy, get confident with the expectancy outcomes.
10. Continuous Learning
The forex market is dynamic, and so are supply and demand zones. Keep learning and adapting to market conditions.
Conclusion
Identifying supply and demand zones is a fundamental skill for every forex trader. While it may seem complex at first, with practice and patience, you’ll become adept at spotting these critical areas on your charts. Remember, simplicity and continuous learning are your best allies in mastering this skill.
Happy trading!Eager to dive into the financial markets? Click this link to open a live account with Tradeview Markets and start your journey to financial success.
About the Author
Oliver Garcia
Senior Market Analyst at Tradeview Markets
email: ogarcia@tvmarkets.com
LinkedIn: https://www.linkedin.com/in/ogfxtrader/


